
Executive dashboards, and the color standard under them.
I design complex information systems, analytics products, and interfaces that make data easier to understand and act on.
Executive dashboards, and the color standard under them.

A published data page a week, four years, three mastheads.
WCAG ramps, CVD simulation, ΔE checking.

Fifty cities, traced back to their continents.

Six Sankeys across knee, hip, CABG and skin cases.

How big the prize is, and how long until you see it.

Burnout and anxiety, read as density. Placed fourth at Chart Champ.
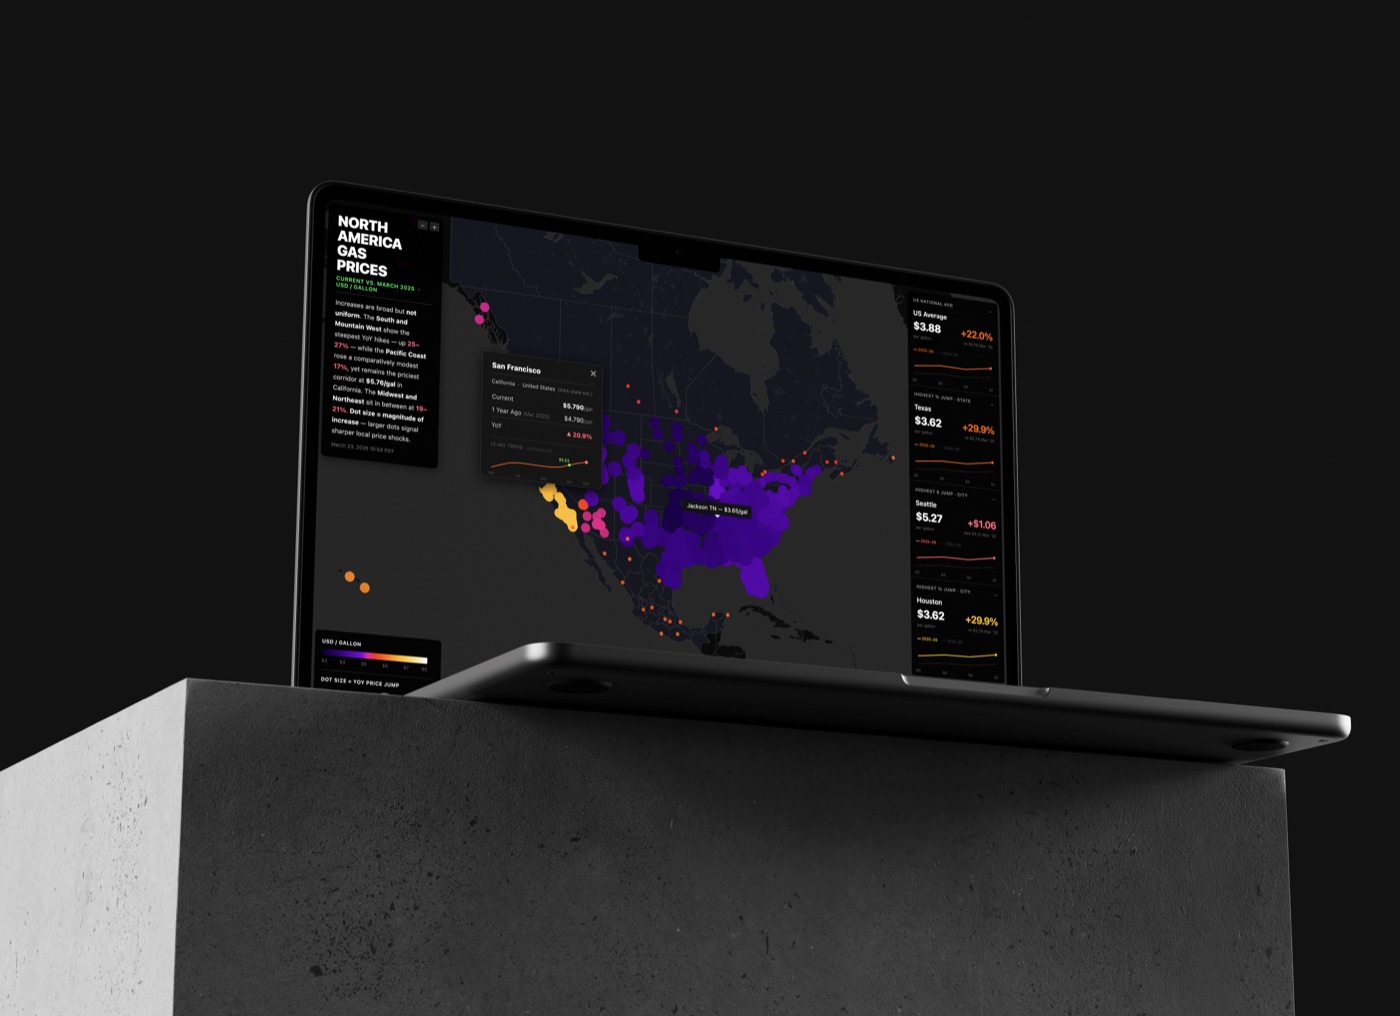
Live symbol map. Pulls current data, holds up on mobile.

A year of my own telemetry. 1:39 down to 1:28.

Covers, feature spreads and print, three mastheads.

Identity systems for regional businesses.